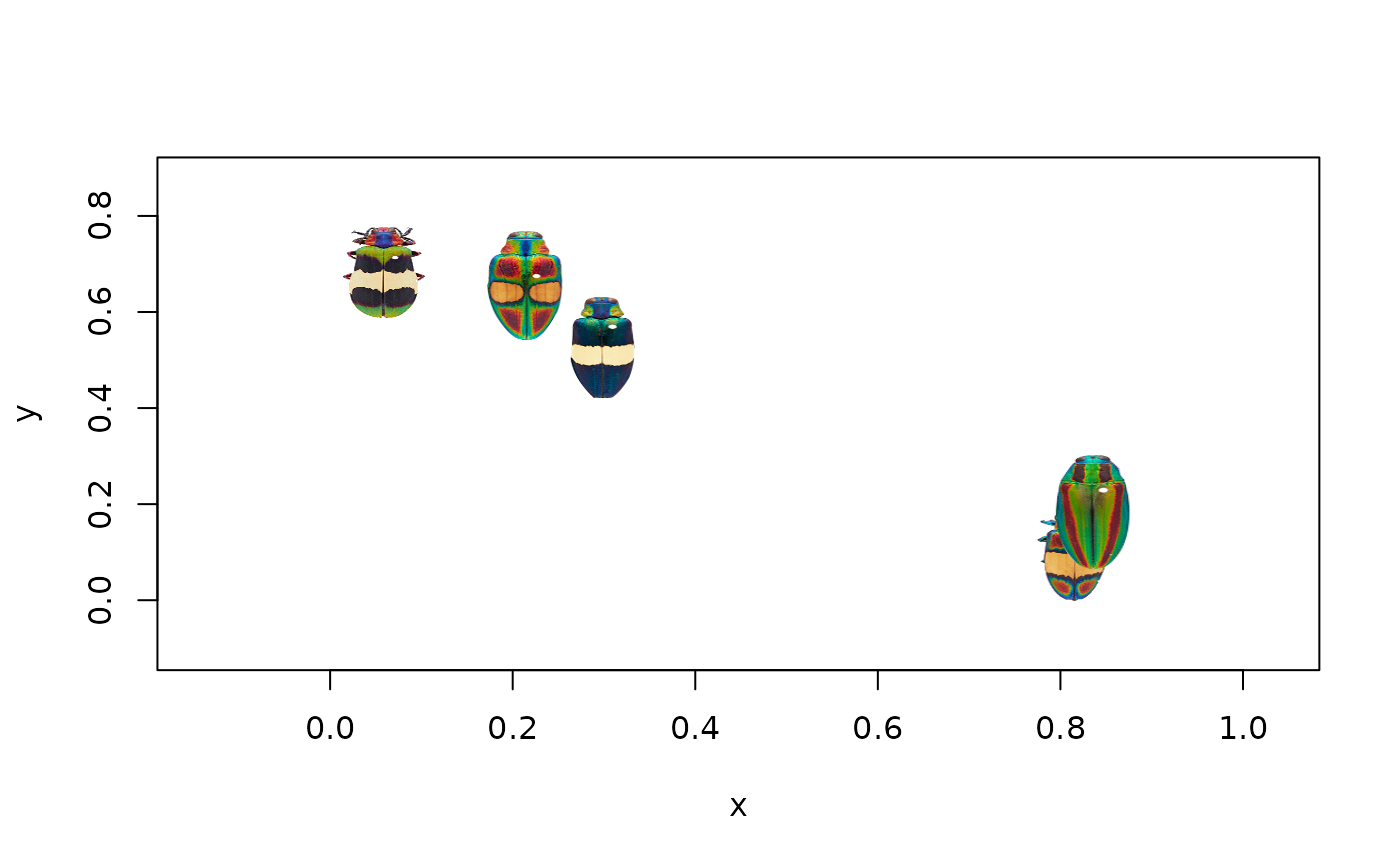
Adds a raster image (a 3D array) to an existing plot as an image. A silly, generic function, but nice for visualization. Sort of like graphics::points, but for images.
Arguments
- obj
An array of the dimensions height x width x channels, such as read in by png::readPNG or readImage, or the
original_imgandrecolored_imgelements of arecolorizeobject.- x, y
The x and y coordinates on which the image should be centered.
- width
Image width, in x-axis units.
- interpolate
Passed to graphics::rasterImage. Use linear interpolation when scaling the image?
- angle
Passed to graphics::rasterImage. The angle (in degrees) for rotating the image.