Plots the output of imDist() as a heatmap.
Arguments
- mat
A color distance matrix, preferably output of
imDist().- palette
The color palette to be used. Default is blue to red (
colorRamps::blue2red(100)).- main
Plot title.
- range
Range for heatmap values. Defaults to the range of values in the matrix, but should be set to the same range for all images if comparing heatmaps.
- legend
Logical. Add a continuous color legend?
- ...
Parameters passed to
graphics::image().
Examples
chongi <- system.file("extdata/chongi.png", package = "recolorize")
chongi <- png::readPNG(chongi)
chongi_k <- recolorize(chongi, "k", n = 5)
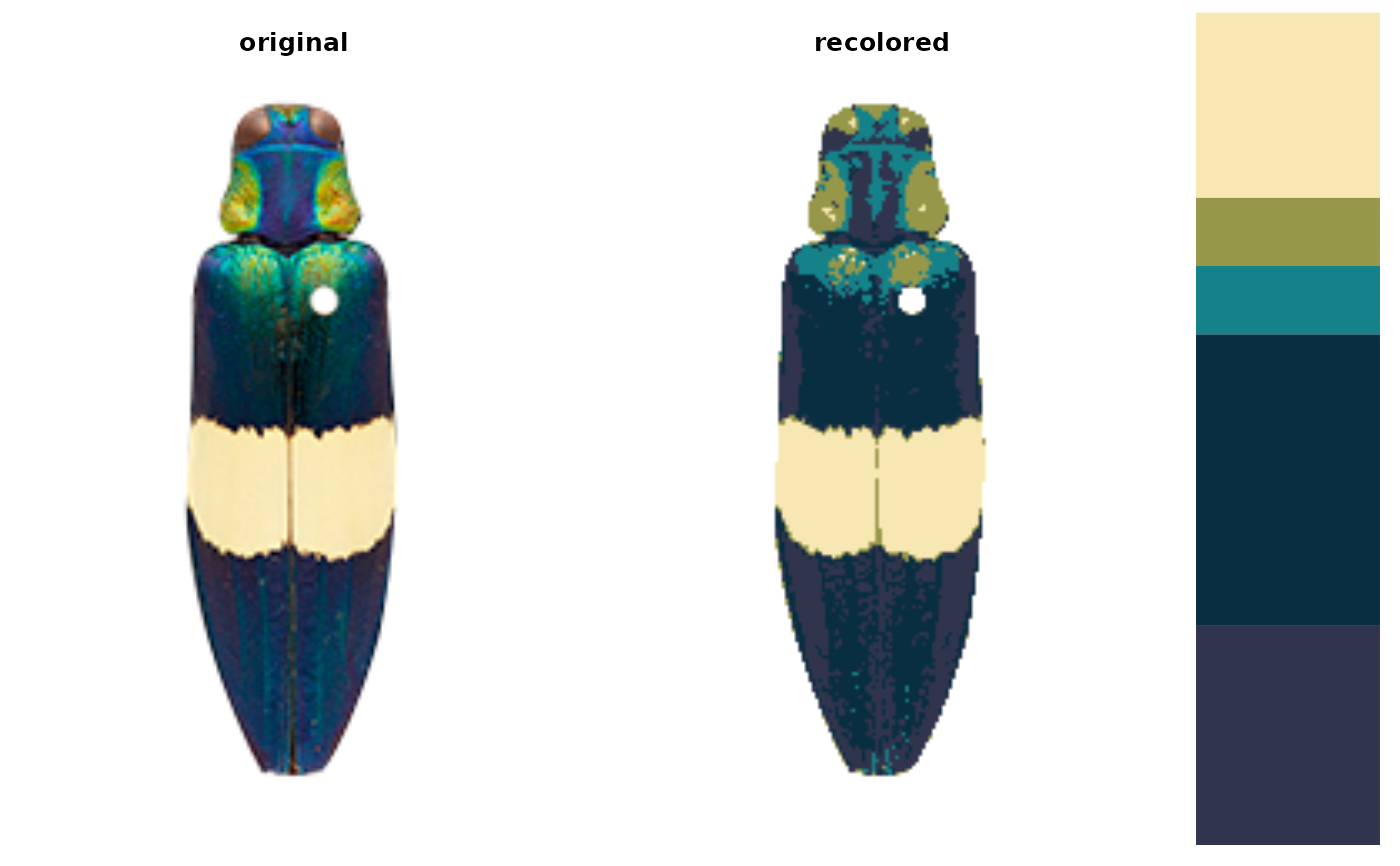 recolored_chongi <- constructImage(chongi_k$pixel_assignments,
chongi_k$centers)
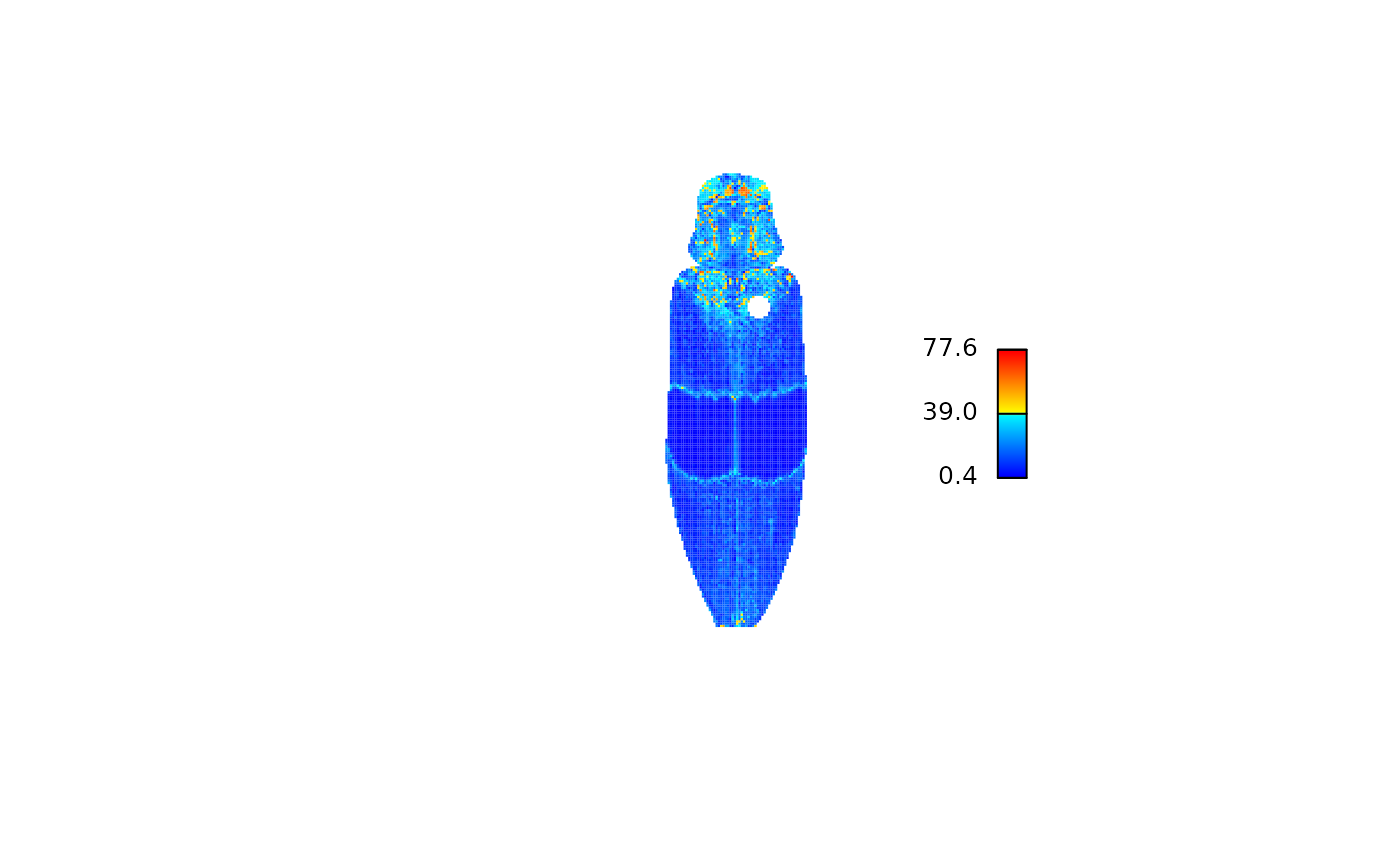
d <- imDist(chongi,
recolored_chongi, plotting = FALSE)
# original flavor
imHeatmap(d)
recolored_chongi <- constructImage(chongi_k$pixel_assignments,
chongi_k$centers)
d <- imDist(chongi,
recolored_chongi, plotting = FALSE)
# original flavor
imHeatmap(d)
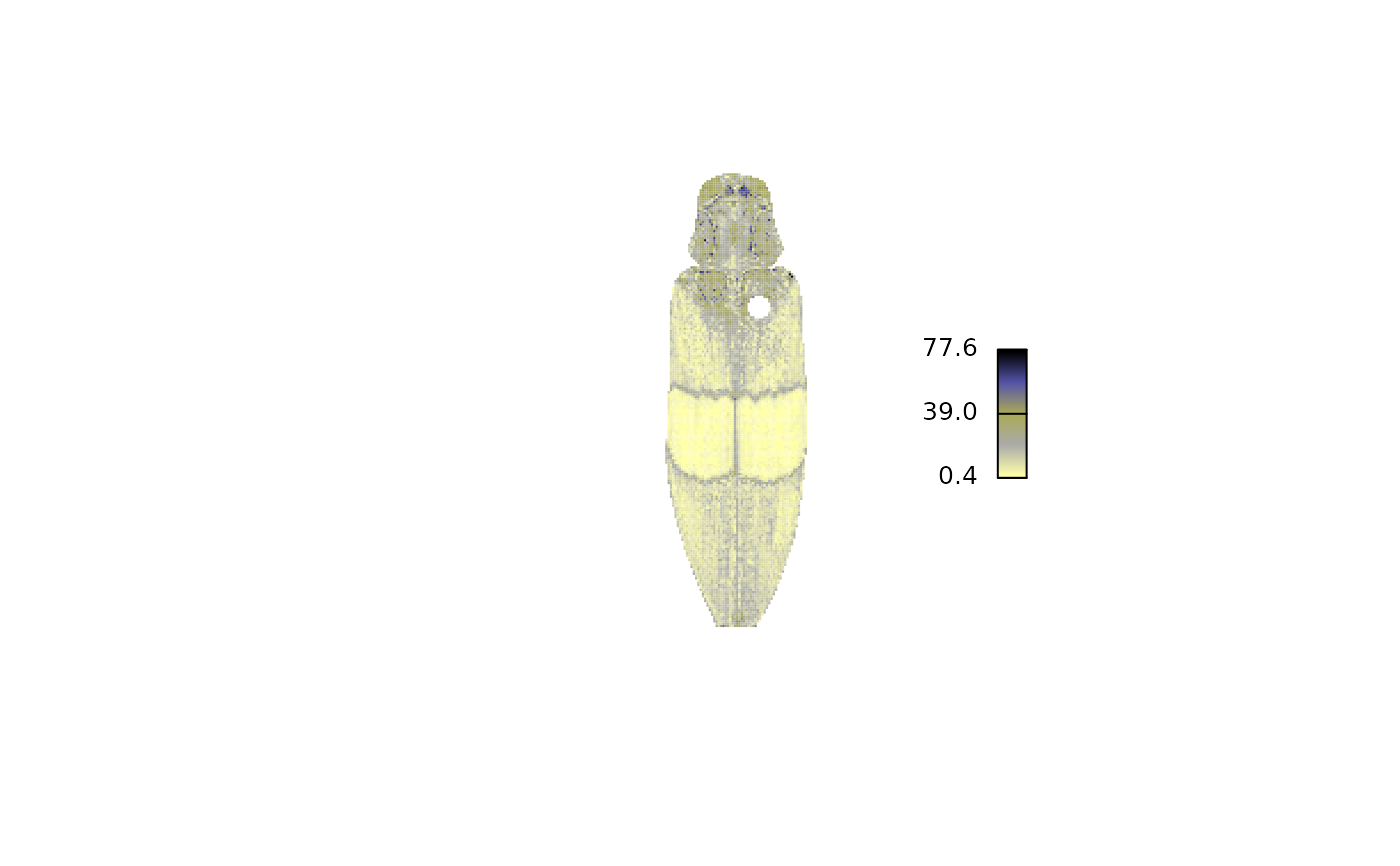
 # bit offputting
imHeatmap(d, palette = colorRamps::ygobb(100))
# bit offputting
imHeatmap(d, palette = colorRamps::ygobb(100))
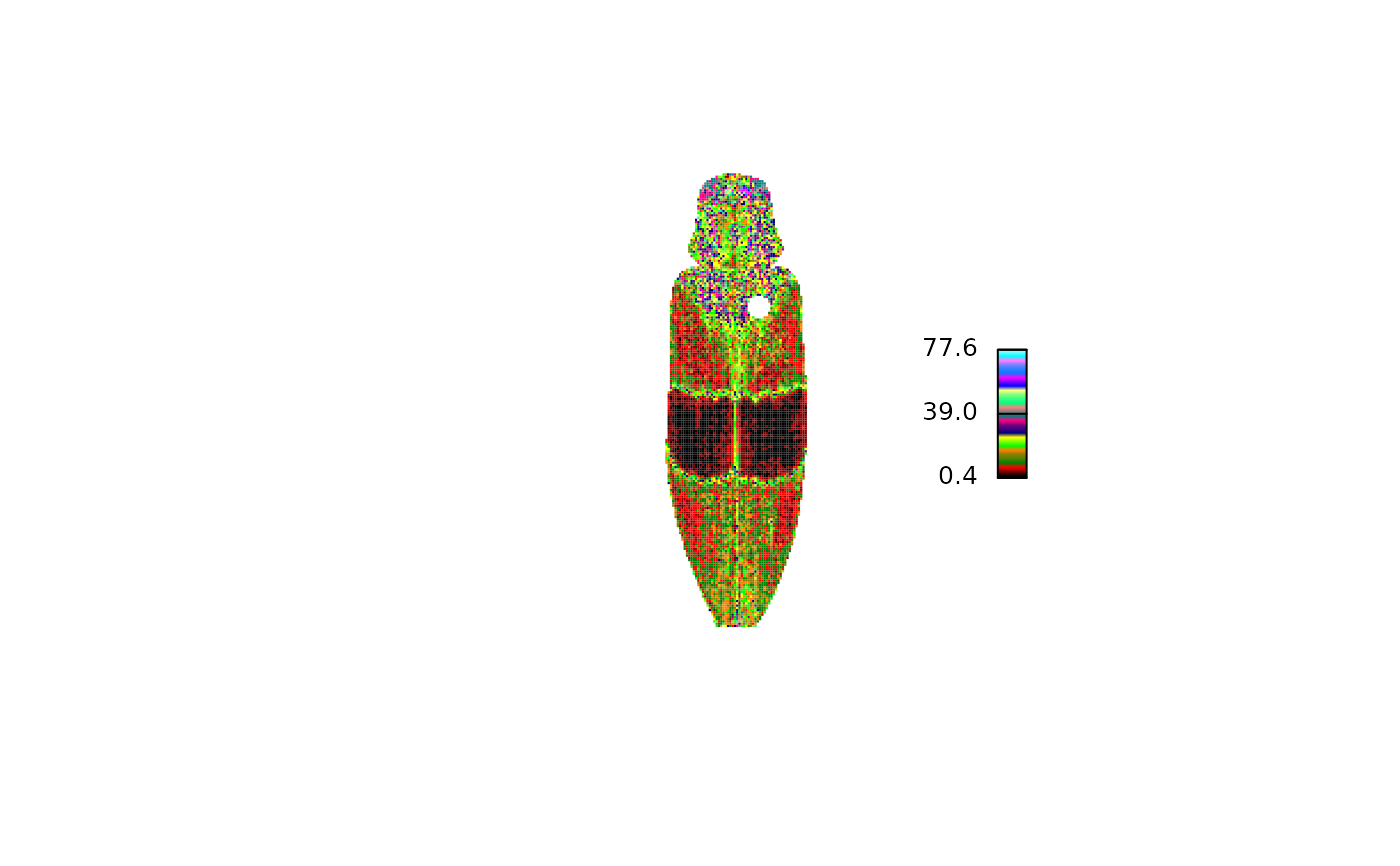
 # just dreadful
imHeatmap(d, palette = colorRamps::primary.colors(100))
# just dreadful
imHeatmap(d, palette = colorRamps::primary.colors(100))