Color-based image segmentation (for people with other things to do).

Comparison of color maps produced using k-means clustering (center) vs.
recolorize(right). Original image credits: John E. Randall, Nathan P. Lord, and Alison Davis-Rabosky.
- Update, Feb. 2024: Please cite the article if you’re using this package! (Also, please read the article)
- Update, Dec. 2021: recolorize is now on CRAN!
- Update, Sept. 2021: A methods manuscript is in progress, but in the meantime, if you need to cite this package, please cite this abstract.
What is this?
This is a package for making color maps, which are needed (or at least useful) for a wide range of color analysis techniques. It was born out of conversations with many biologists who found, to their surprise and mine, that generating color maps were the bottleneck step in their analyses. Fully automated methods rarely work all of the time, and are difficult to modify, while fully manual methods are subjective and time-consuming. This package tries to split the difference by giving you a mix of tools that will do a pretty good job with no user input, and then allow minor manual changes like merging and filtering layers or splitting components, before exporting them to the next step of your analysis (e.g. pavo, patternize). It’s also, for the most part, totally deterministic – no arbitrary seed-setting for repeatability.
Quick start
Install the package:
# development version:
install.packages("devtools")
devtools::install_github("hiweller/recolorize")

# OR
install.packages("recolorize") # CRAN release
To run recolorize on a single image:
library(recolorize)

# load an image that comes with the package:
img <- system.file("extdata/corbetti.png", package = "recolorize")
rc <- recolorize2(img, cutoff = 45)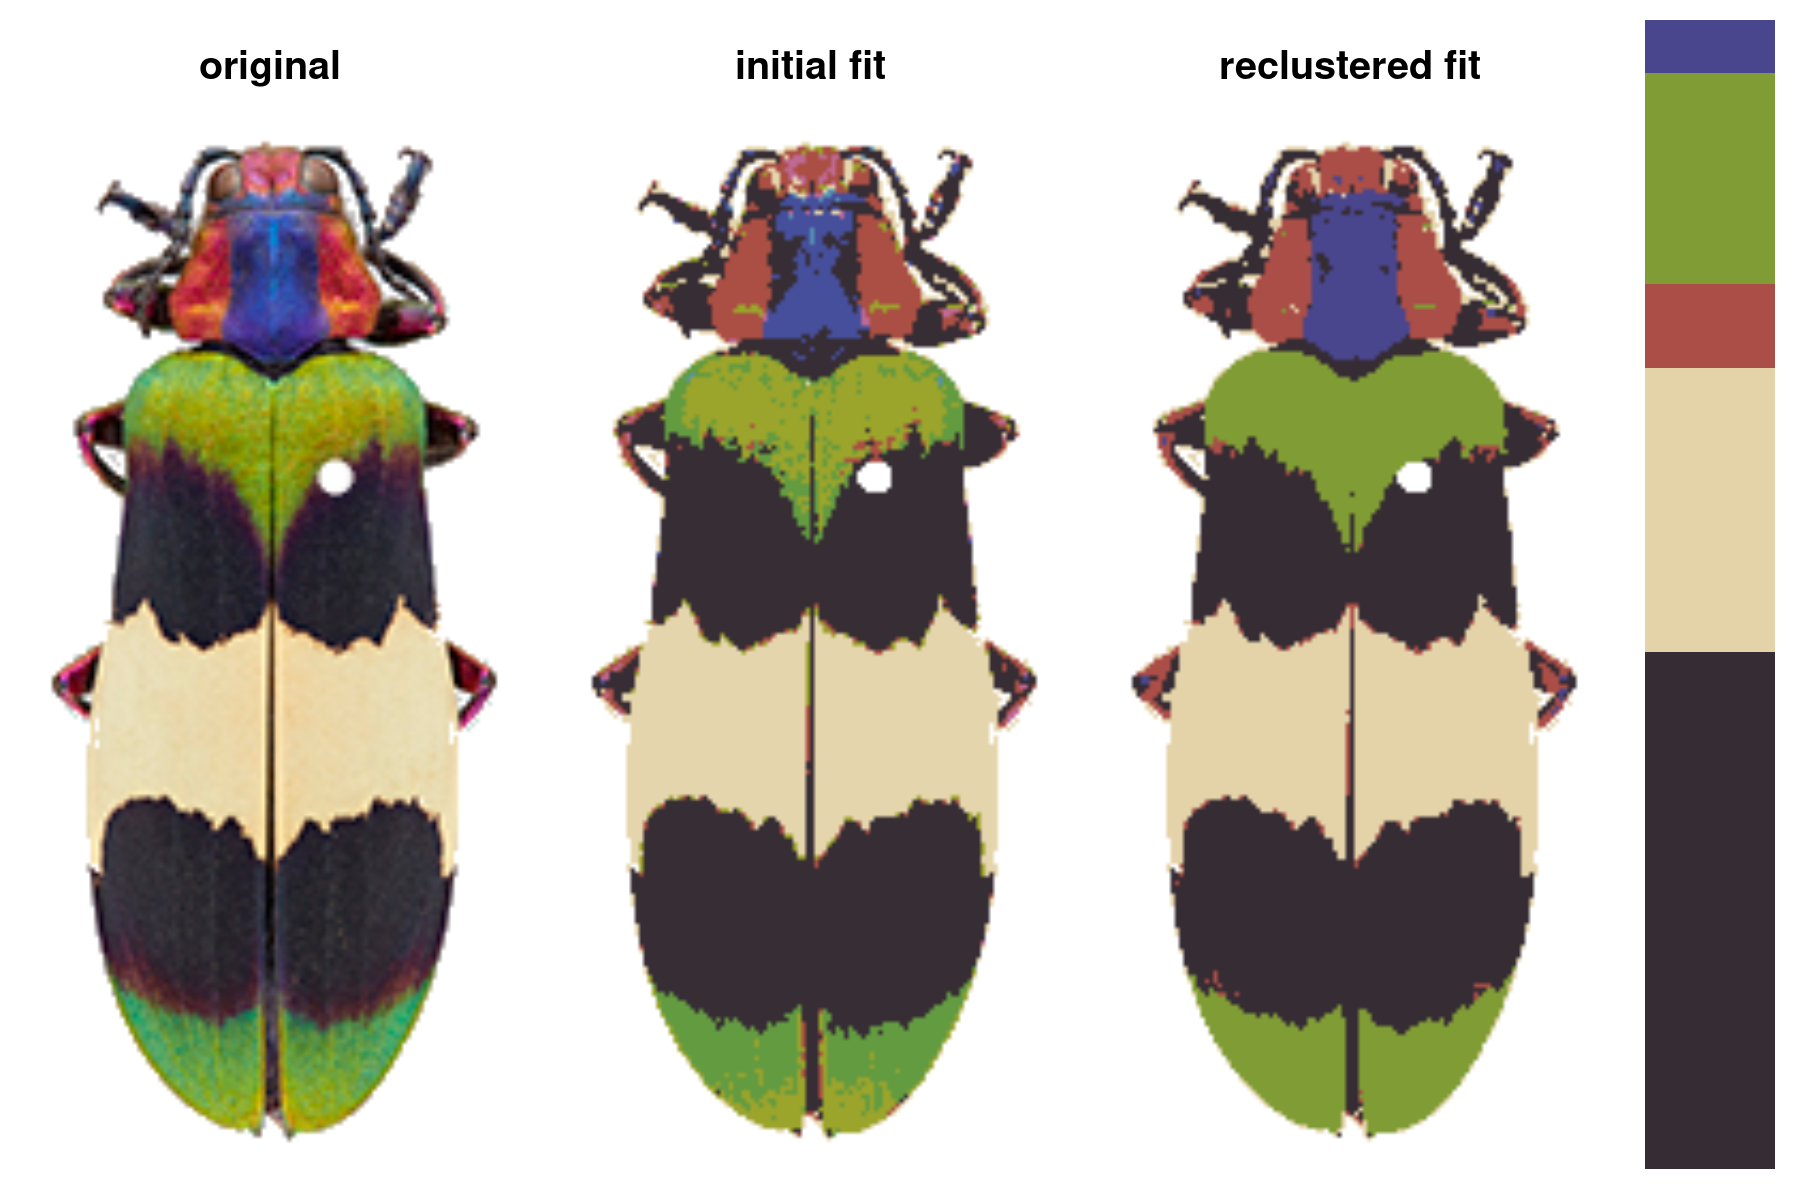
A batch processing example:
# get list of all PNGs that come with the package:
images <- dir(system.file("extdata", package = "recolorize"),
             pattern = ".png", full.names = TRUE)

# for every image...
for (i in 1:length(images)) {

  # get an initial fit with generic clustering
  init_fit <- recolorize2(images[i], method = "hist", bins = 2, cutoff = 25, plotting = FALSE)

  # drop small patches
  refined_fit <- thresholdRecolor(init_fit, pct = 0.01, plotting = FALSE)

  # store in an output variable
  if (i == 1) {
    colormap_list <- list(refined_fit)
  } else {
    colormap_list[[i]] <- refined_fit
  }
}

# compare original to recolored images:
layout(matrix(1:10, nrow = 2, byrow = TRUE))
par(mar = rep(0, 4))
o <- lapply(colormap_list, function(i) plot(i$original_img))
r <- lapply(colormap_list, function(i) plotImageArray(recoloredImage(i)))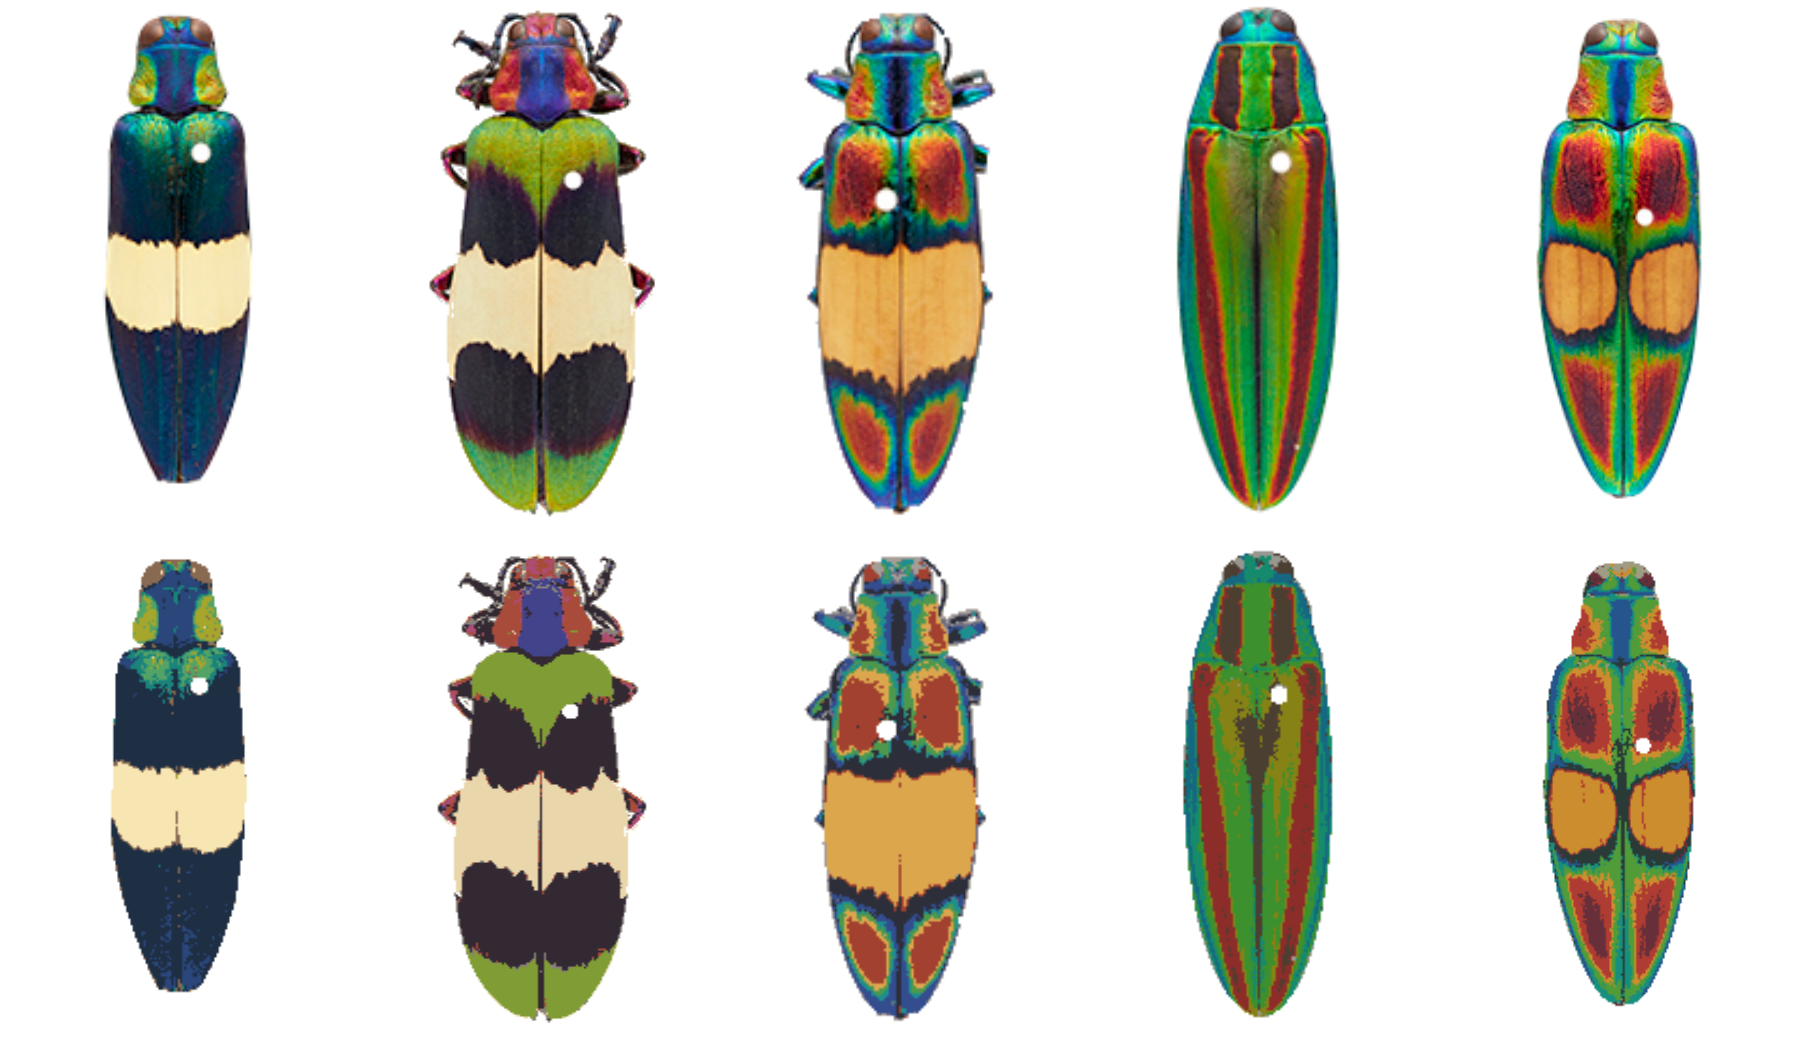
See package vignettes for detailed documentation.
How does it work?
Recolorize is a toolbox of automatic, semi-automatic, and manual methods that aims to give you reproducible results that work pretty well out-of-box, and which are easy to tailor to your needs. The general workflow is an initial clustering step -> an automatic or semi-automatic reclustering step -> optional manual refinements -> export to another format, like an image, a set of binary masks, or another R package.
Contact
Please do email me if this is something that may be relevant for you or if you have questions. Most of the features in the package are the result of feedback, and no method should be developed in a vacuum. If you include example images in your email, my likelihood of responding goes through the roof.
Email: hannahiweller@gmail.com